Automate with GitHub Actions
Run your first automated security scan using GitHub Actions—no local setup required.
This tutorial uses Javaspringvulny, a sample Java Spring application with intentional vulnerabilities. You’ll fork the repo, configure a GitHub Actions workflow, and see real security findings in StackHawk.
Prerequisites
Step 1: Get an API Key
HawkScan authenticates with the StackHawk platform using an API Key. You’ll store this key as a GitHub secret so your workflow can run scans securely.
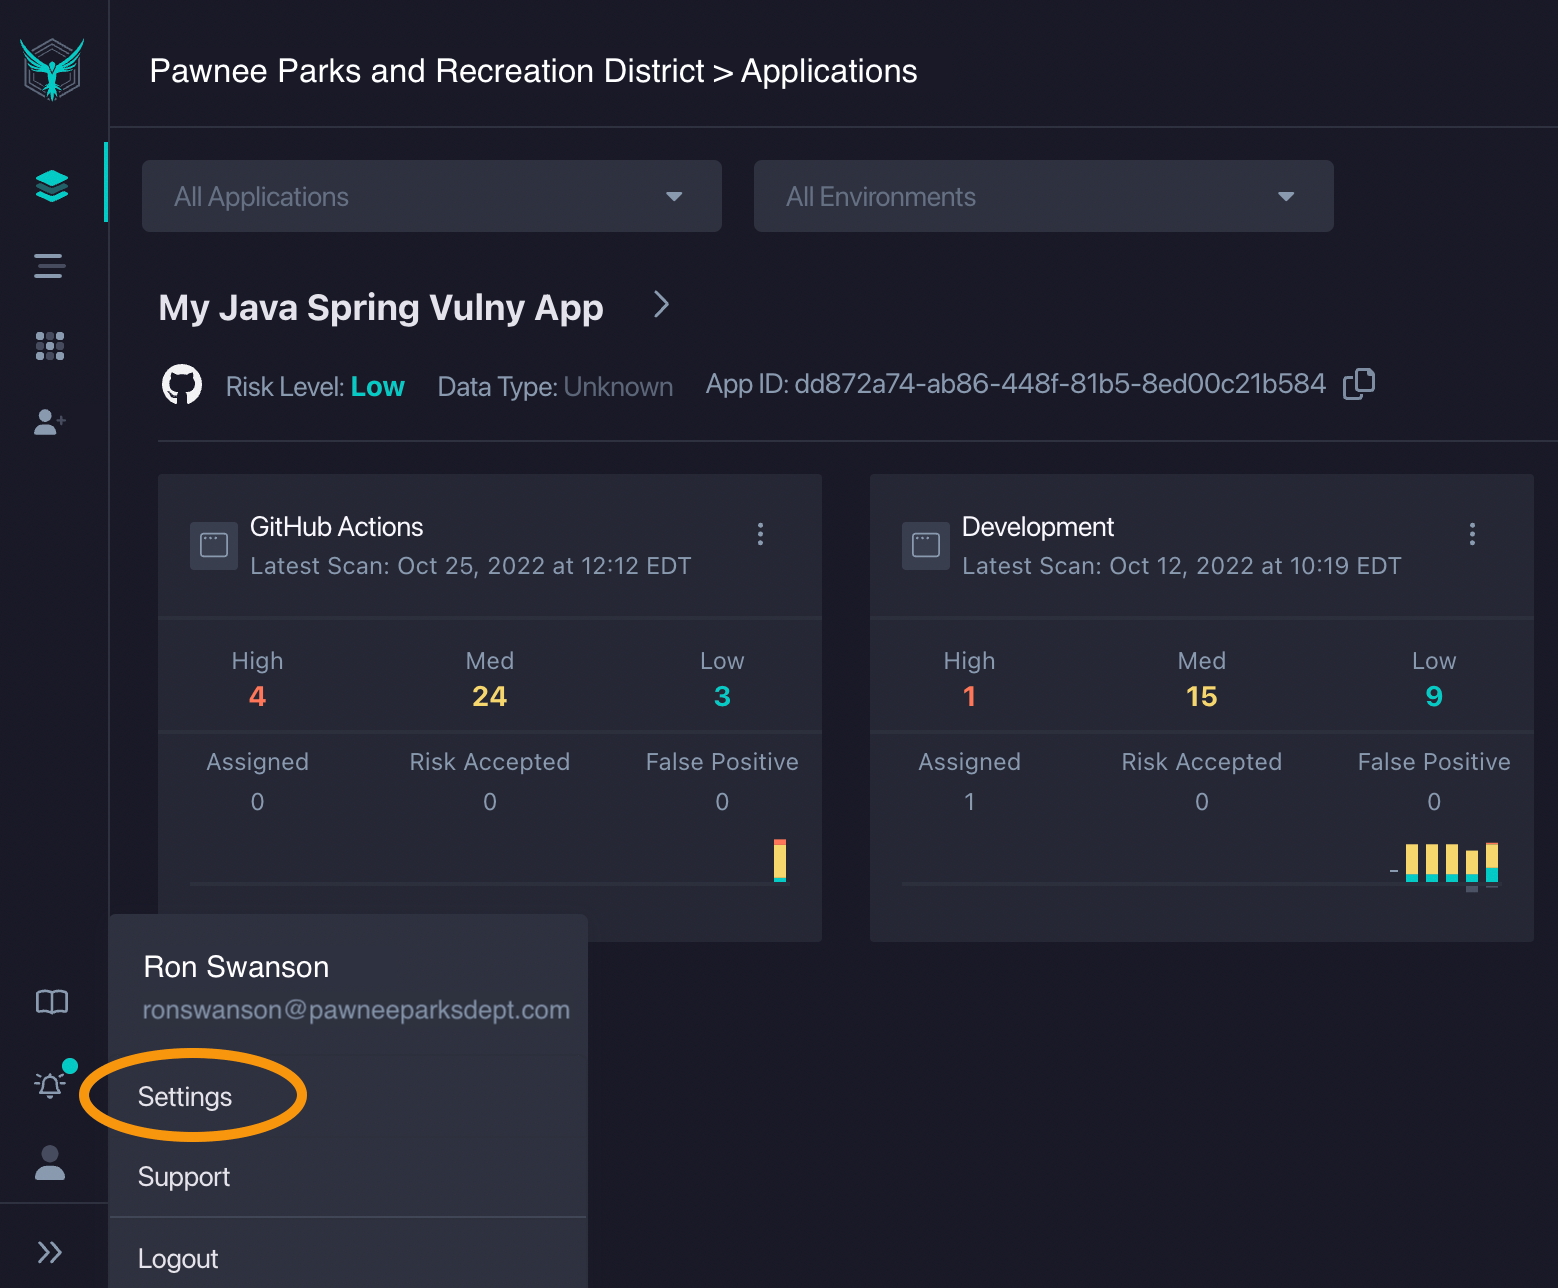
- Click your user icon → Settings
- Click API Keys → Create New API Key
- Copy and save the key securely
Step 2: Fork the Repository
You’ll need your own copy of the sample app to configure the workflow and trigger scans. Forking creates a copy under your GitHub account.
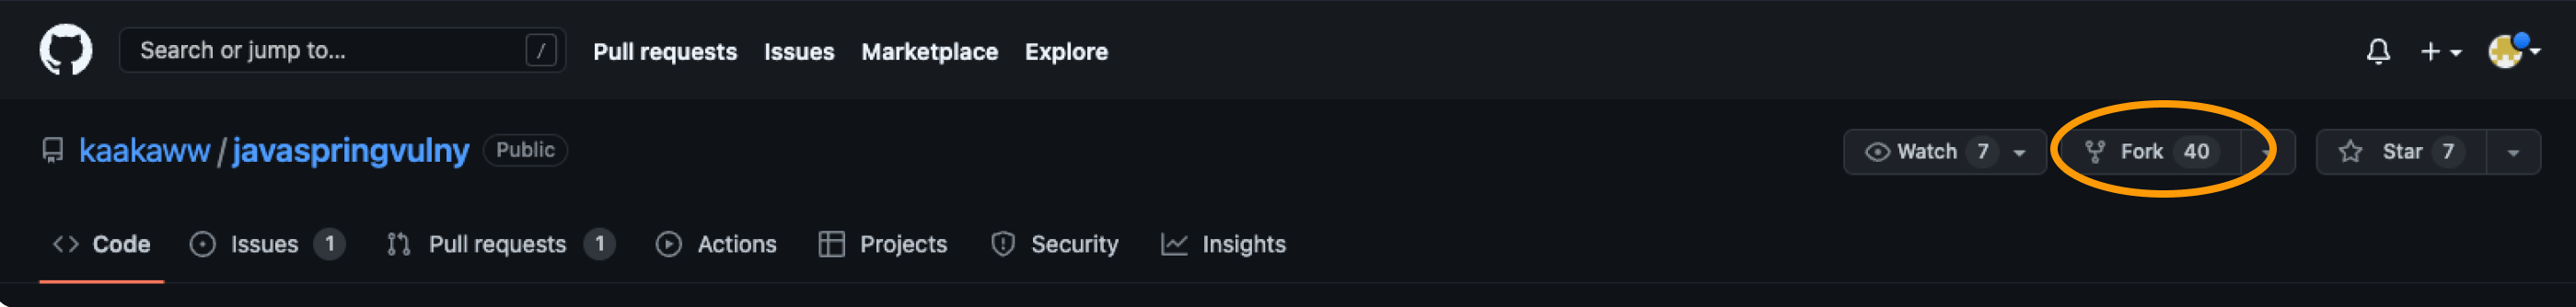
- Go to kaakaww/javaspringvulny
- Click Fork → Create fork
Step 3: Add the API Key as a Secret
GitHub secrets keep sensitive values like API keys out of your code. The workflow will reference this secret to authenticate HawkScan.
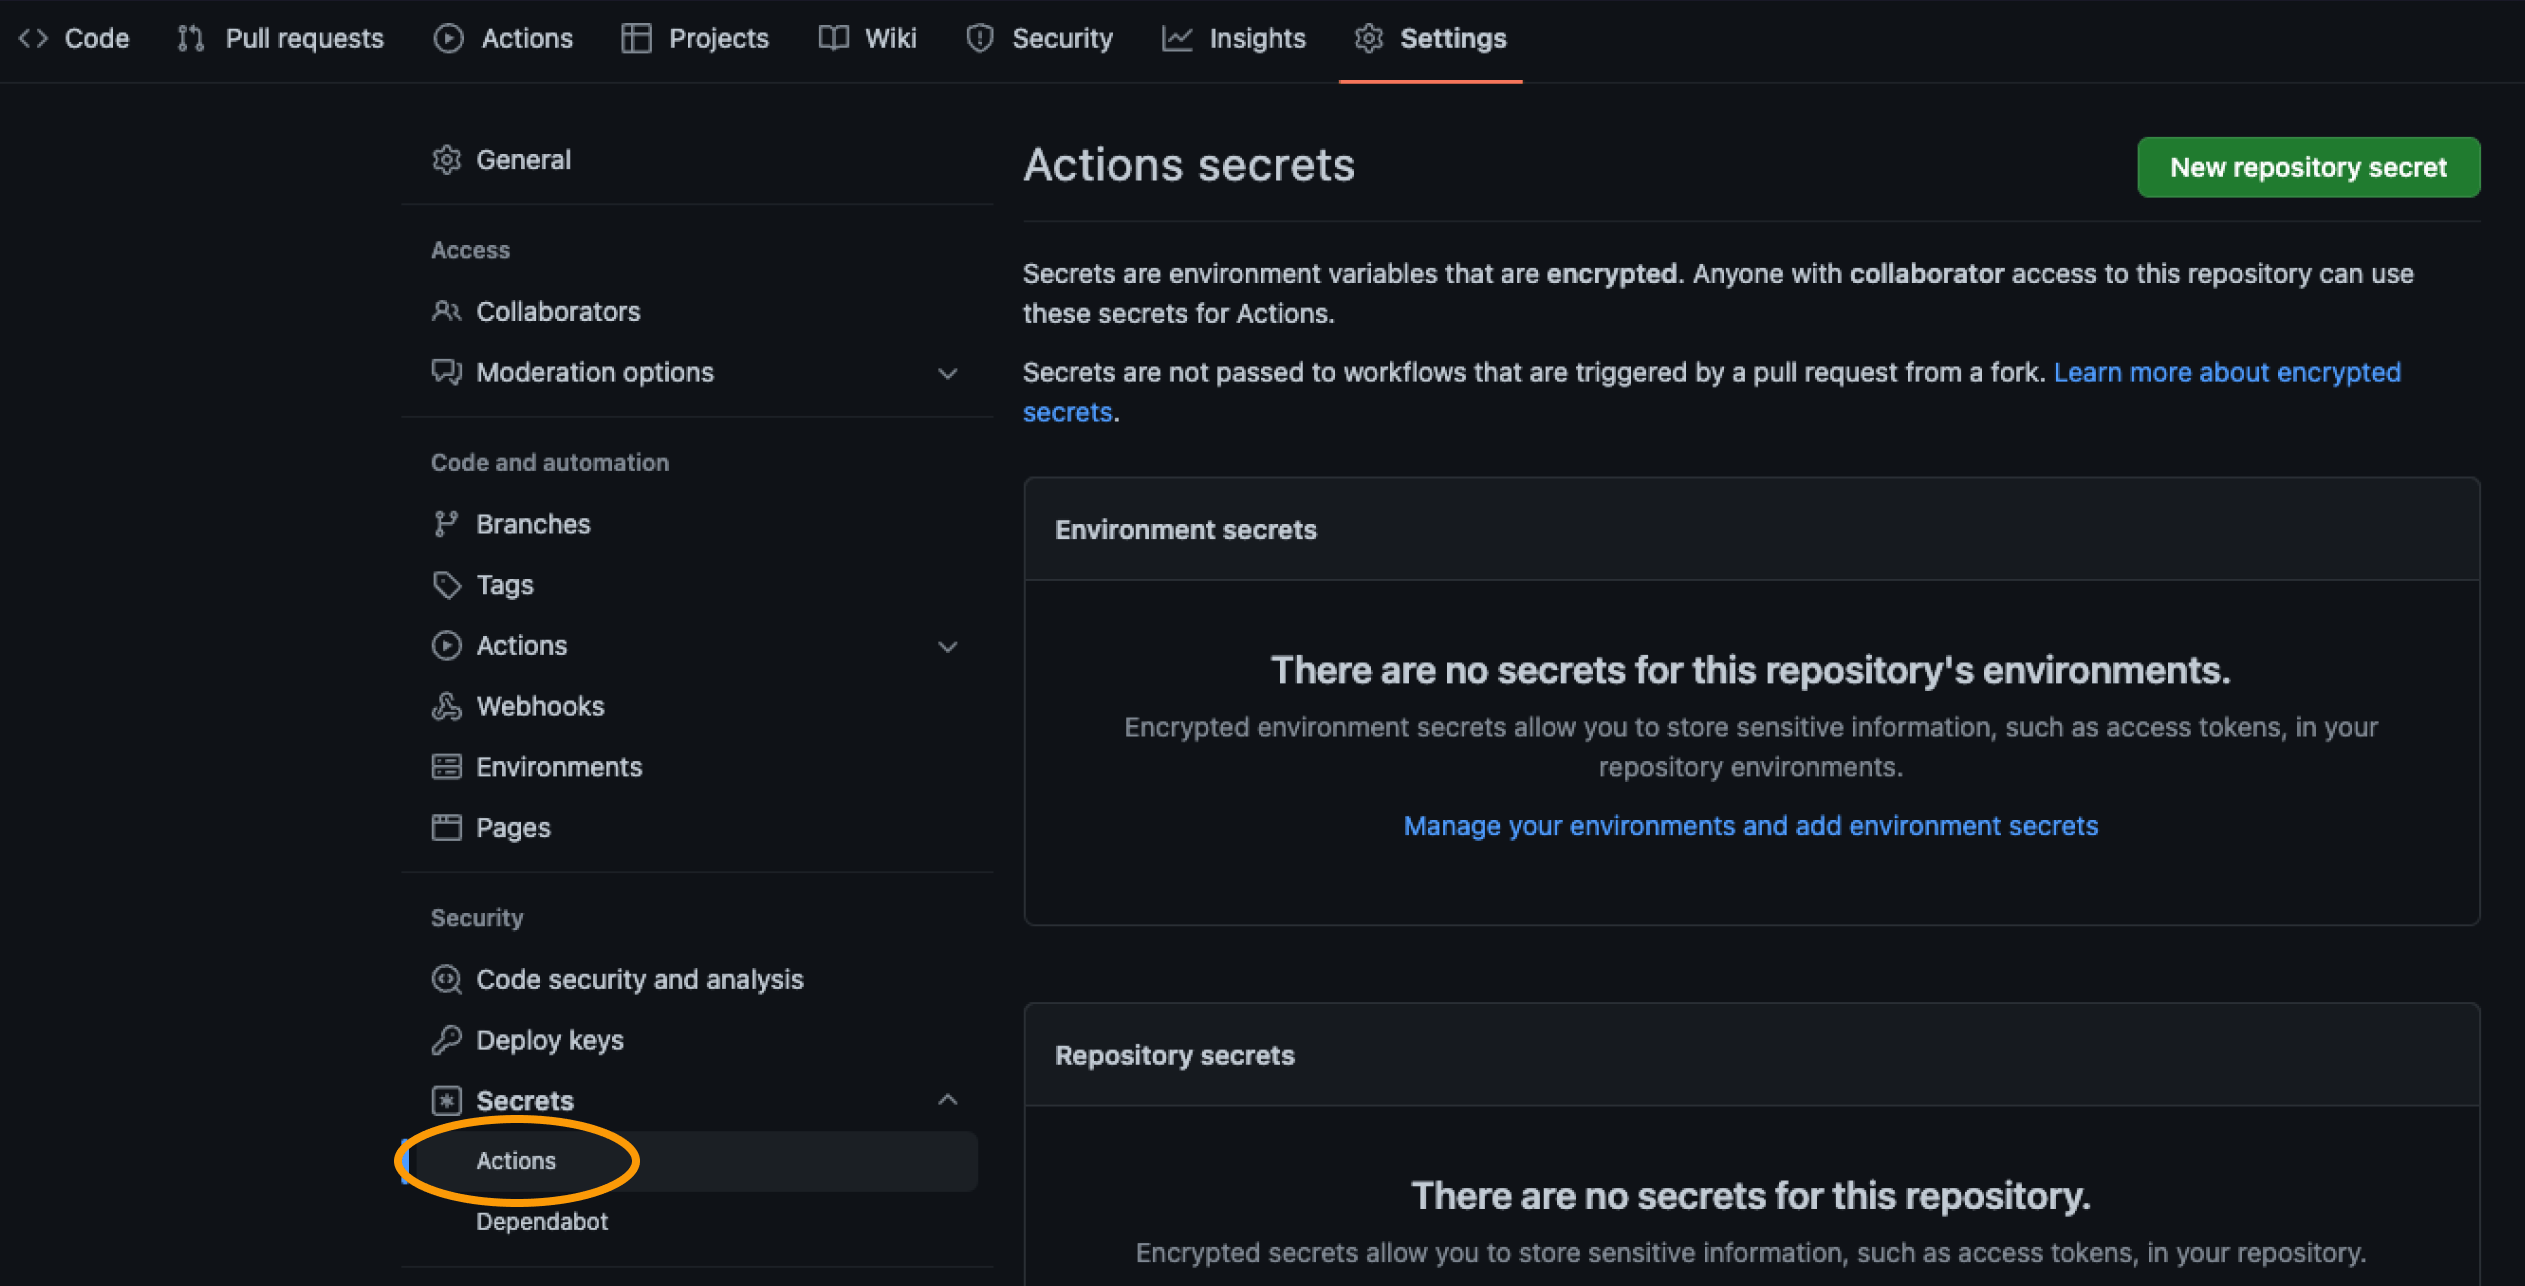
- In your fork, go to Settings → Secrets and variables → Actions
- Click New repository secret
- Name:
HAWK_API_KEY - Value: your StackHawk API key
- Click Add secret
Step 4: Create an Application in StackHawk
Applications in StackHawk organize your scan results by project and environment. Create one now so HawkScan knows where to send findings.
- In StackHawk, click Add an App
- Name:
Javaspringvulny - Environment:
GitHub Actions - Host:
https://localhost:9000 - Type: Dynamic Web Application
- API: REST/OpenAPI
- Click Finish
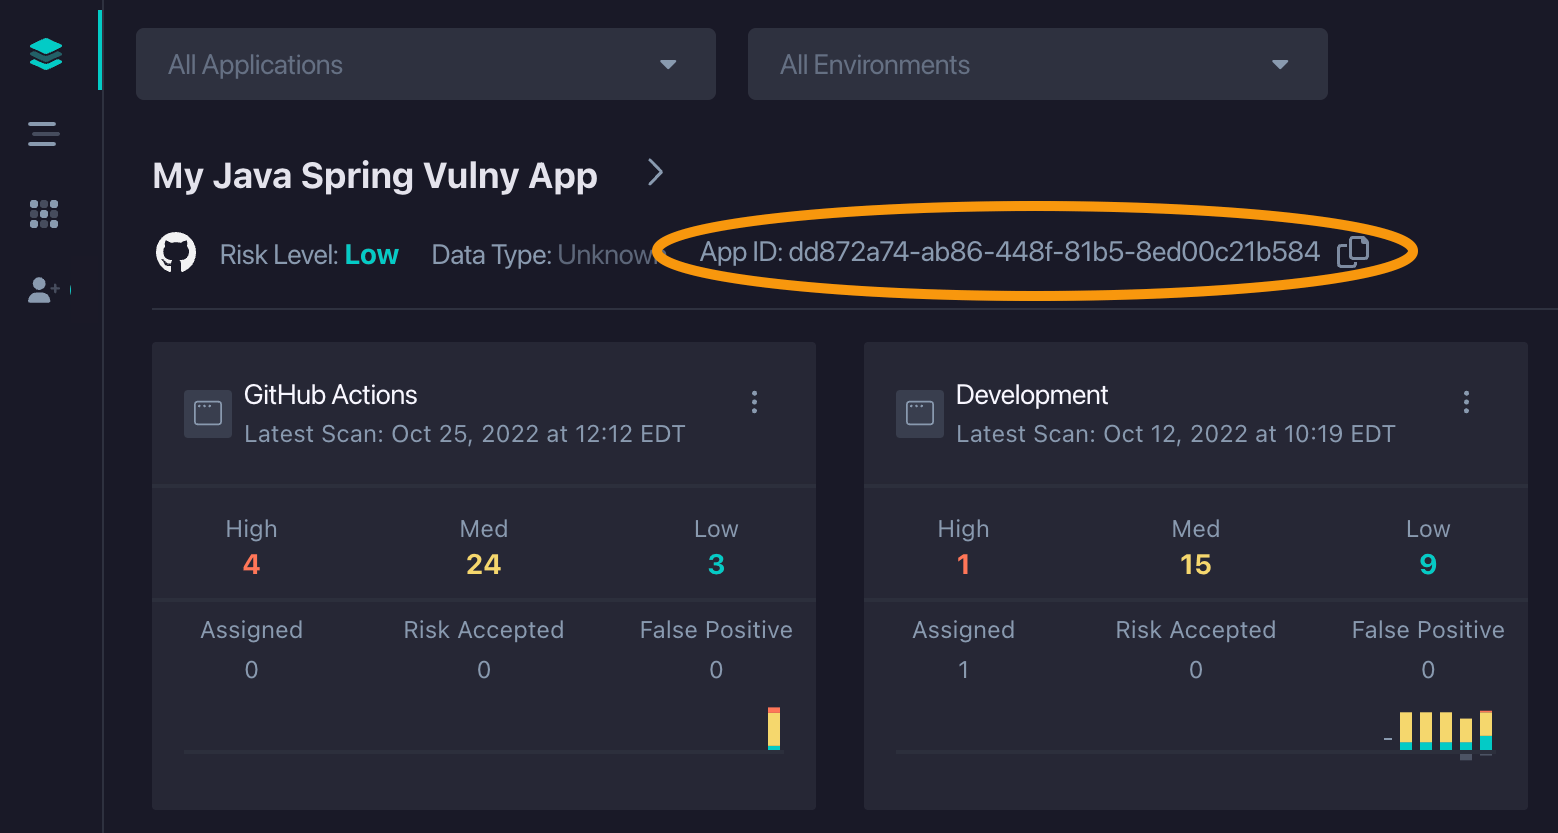
- Copy the Application ID from your app list
Step 5: Enable the GitHub Integration
The GitHub integration posts scan summaries directly to your pull requests. This gives your team visibility into security findings without leaving GitHub.
- In StackHawk, go to Integrations → GitHub
- Click Enable GitHub → Install
- Click Add to connect your Javaspringvulny fork
Step 6: Enable GitHub Actions
GitHub disables workflows in forked repos by default as a security measure. You need to explicitly enable them before your workflow can run.
- In your fork, go to the Actions tab
- Click I understand my workflows, go ahead and enable them
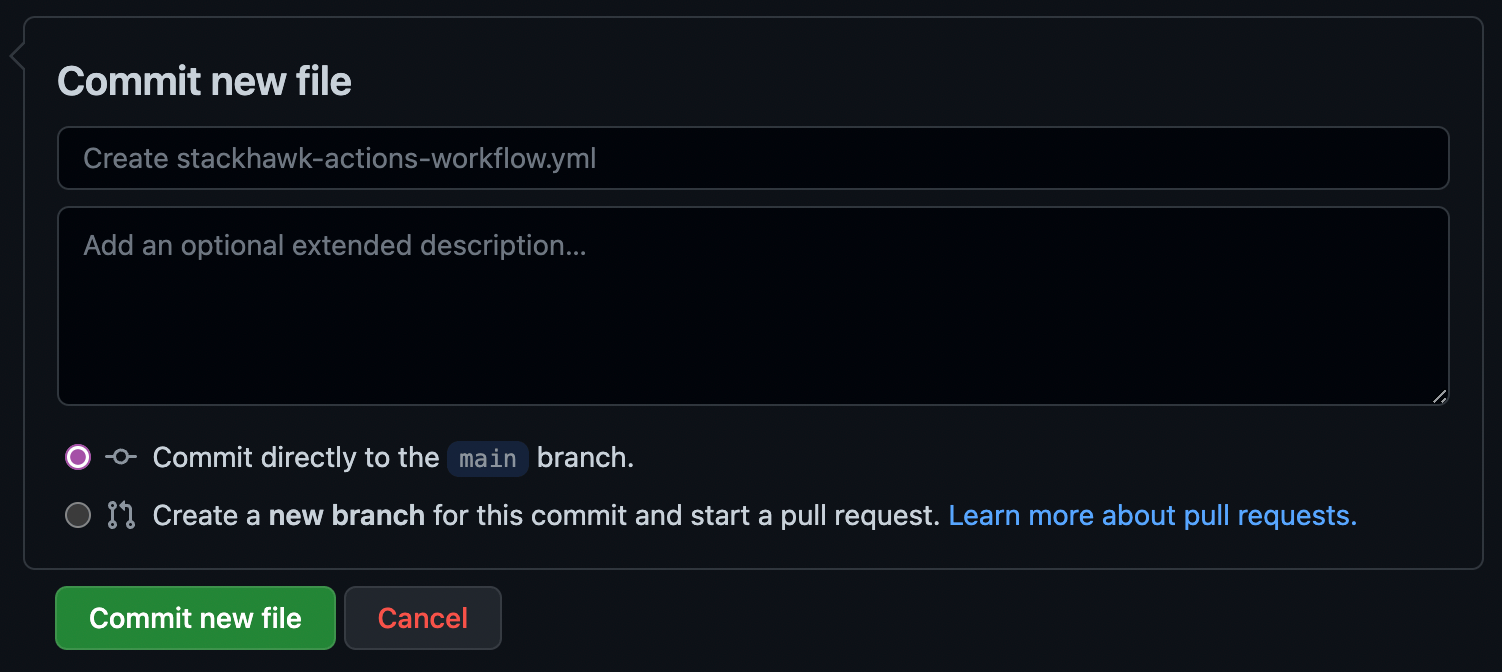
Step 7: Add the Workflow File
This workflow builds the sample app with Docker Compose, then runs HawkScan against it. The scan results are sent to StackHawk and posted to your PR.
Create .github/workflows/stackhawk-actions-workflow.yml:
name: StackHawk

on:
  pull_request:
    branches: [main]
  workflow_dispatch:

jobs:
  hawkscan:
    runs-on: ubuntu-latest
    steps:
      - uses: actions/checkout@v4

      - name: Build and start application
        run: docker compose up -d --build

      - name: Run HawkScan
        uses: stackhawk/hawkscan-action@v2.2.0
        with:
          apiKey: ${{ secrets.HAWK_API_KEY }}
          configurationFiles: stackhawk-actions.yml
        env:
          COMMIT_SHA: ${{ github.event.pull_request.head.sha }}
          BRANCH_NAME: ${{ github.head_ref }}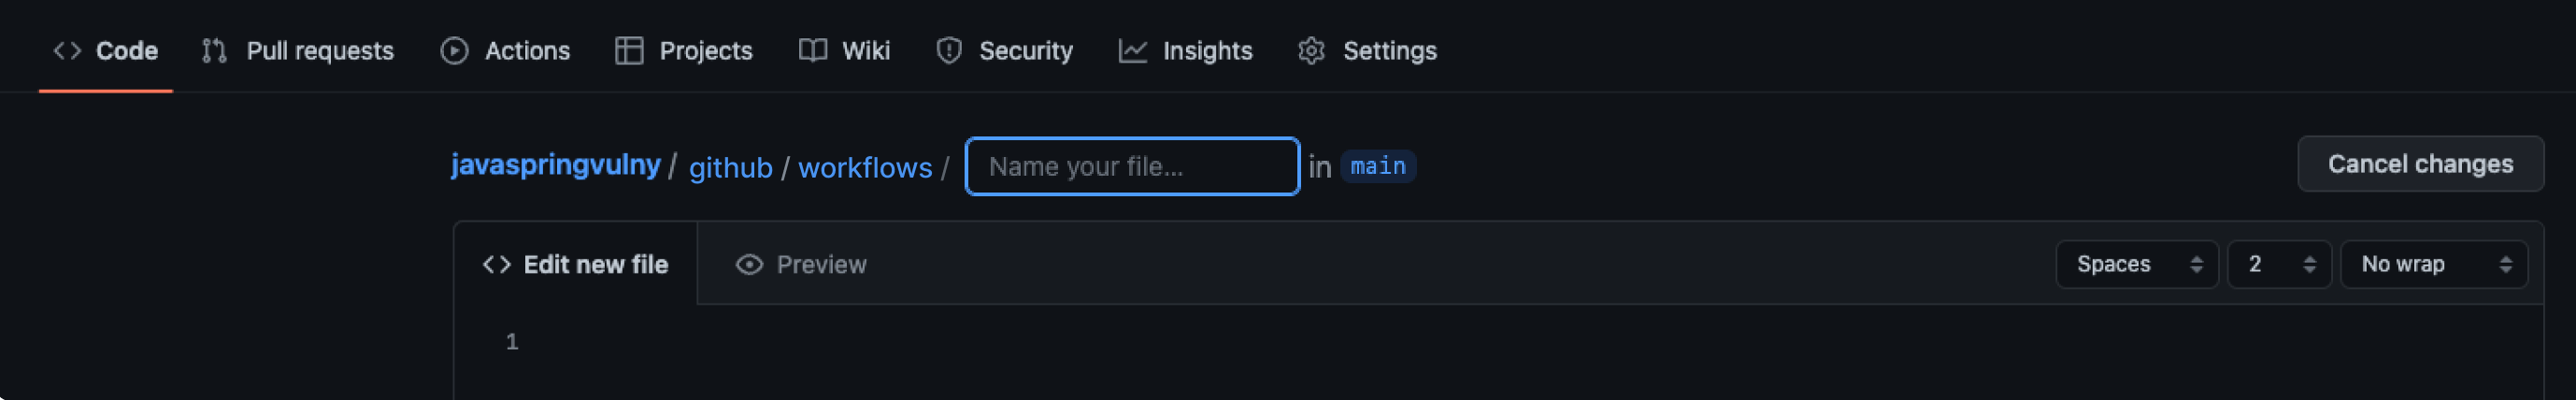
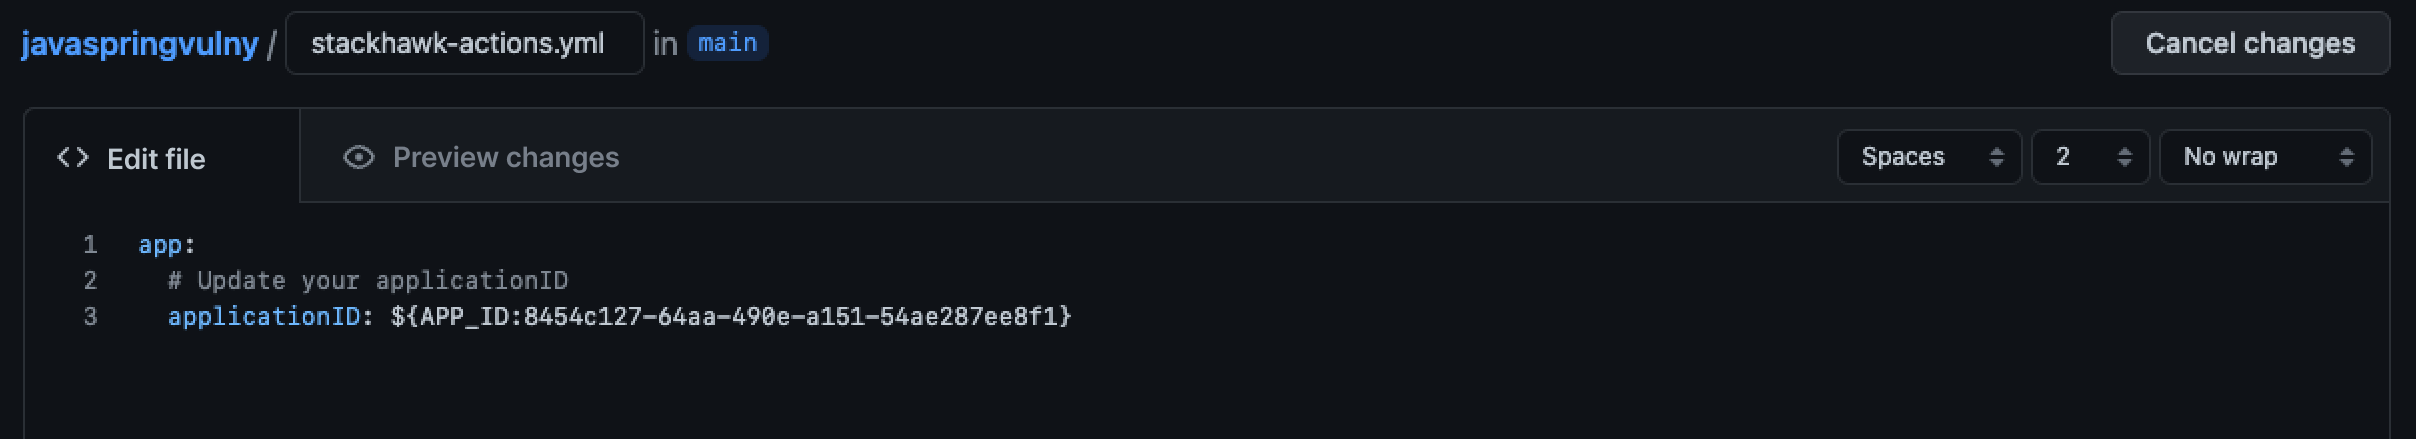
Step 8: Trigger a Scan
Opening a pull request triggers the workflow. Edit the HawkScan config file to add your Application ID—this creates a PR that kicks off your first scan.
- Open
stackhawk-actions.ymlin your fork - Replace
applicationIdwith your Application ID - Select Create a new branch and start a pull request
- Click Create pull request
- Watch the workflow run in the Actions tab

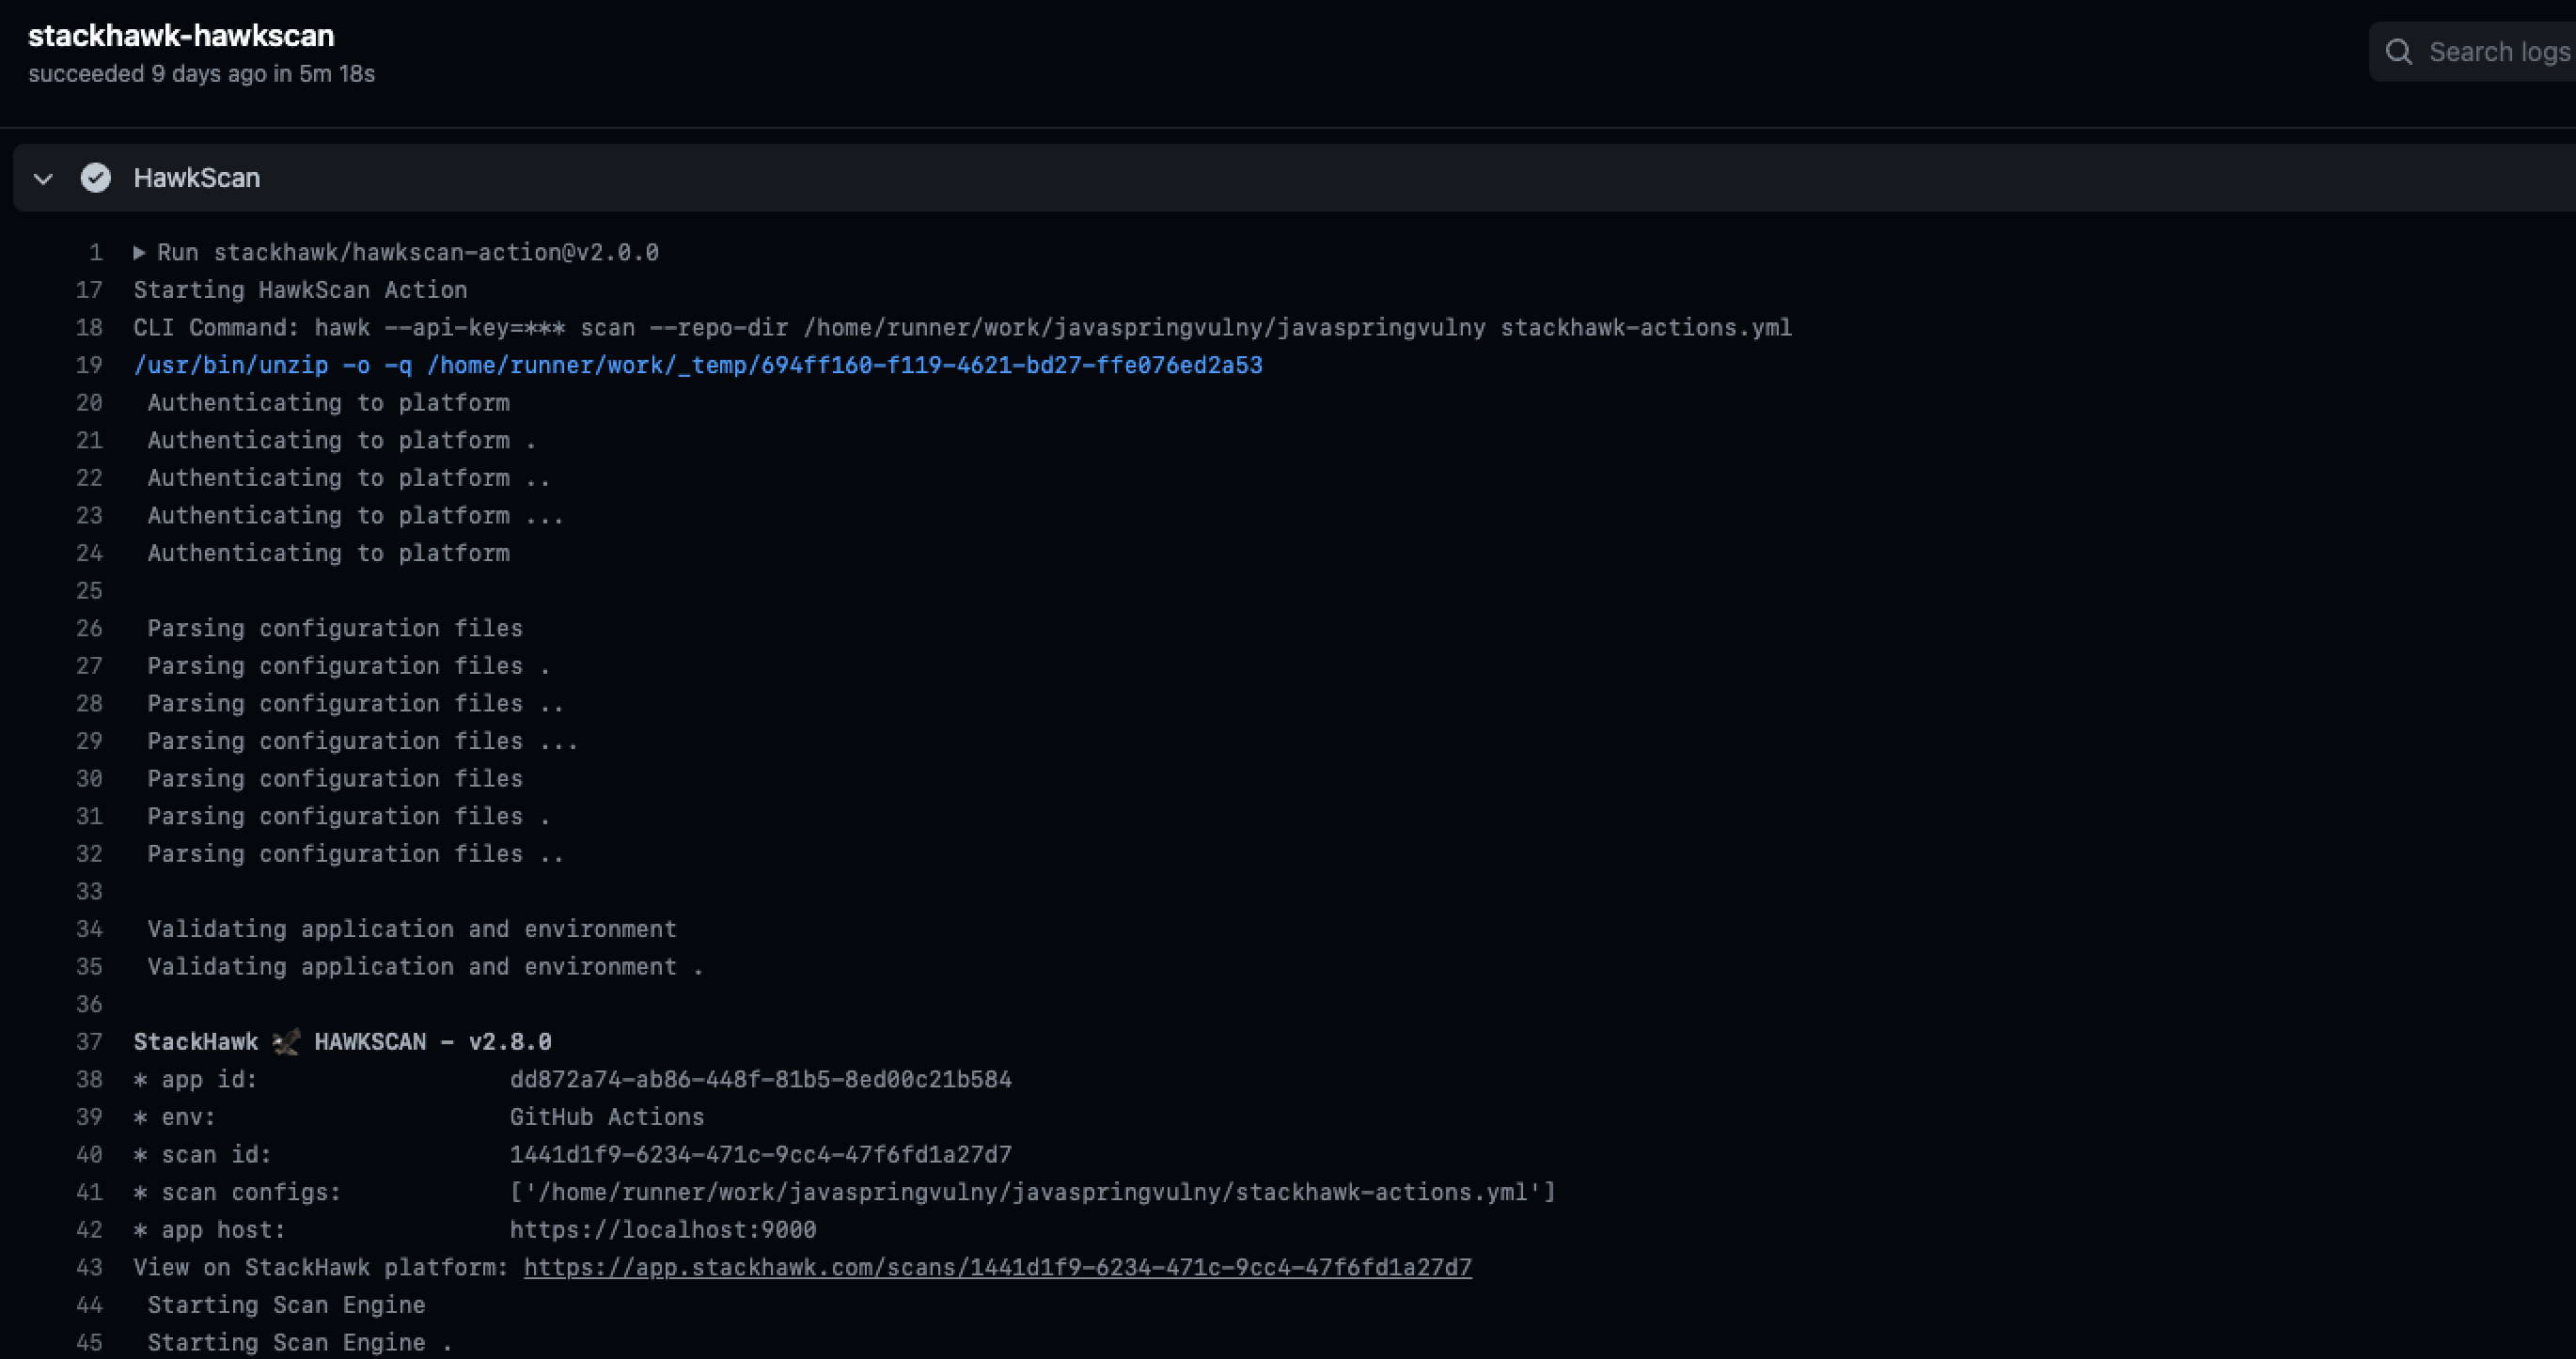
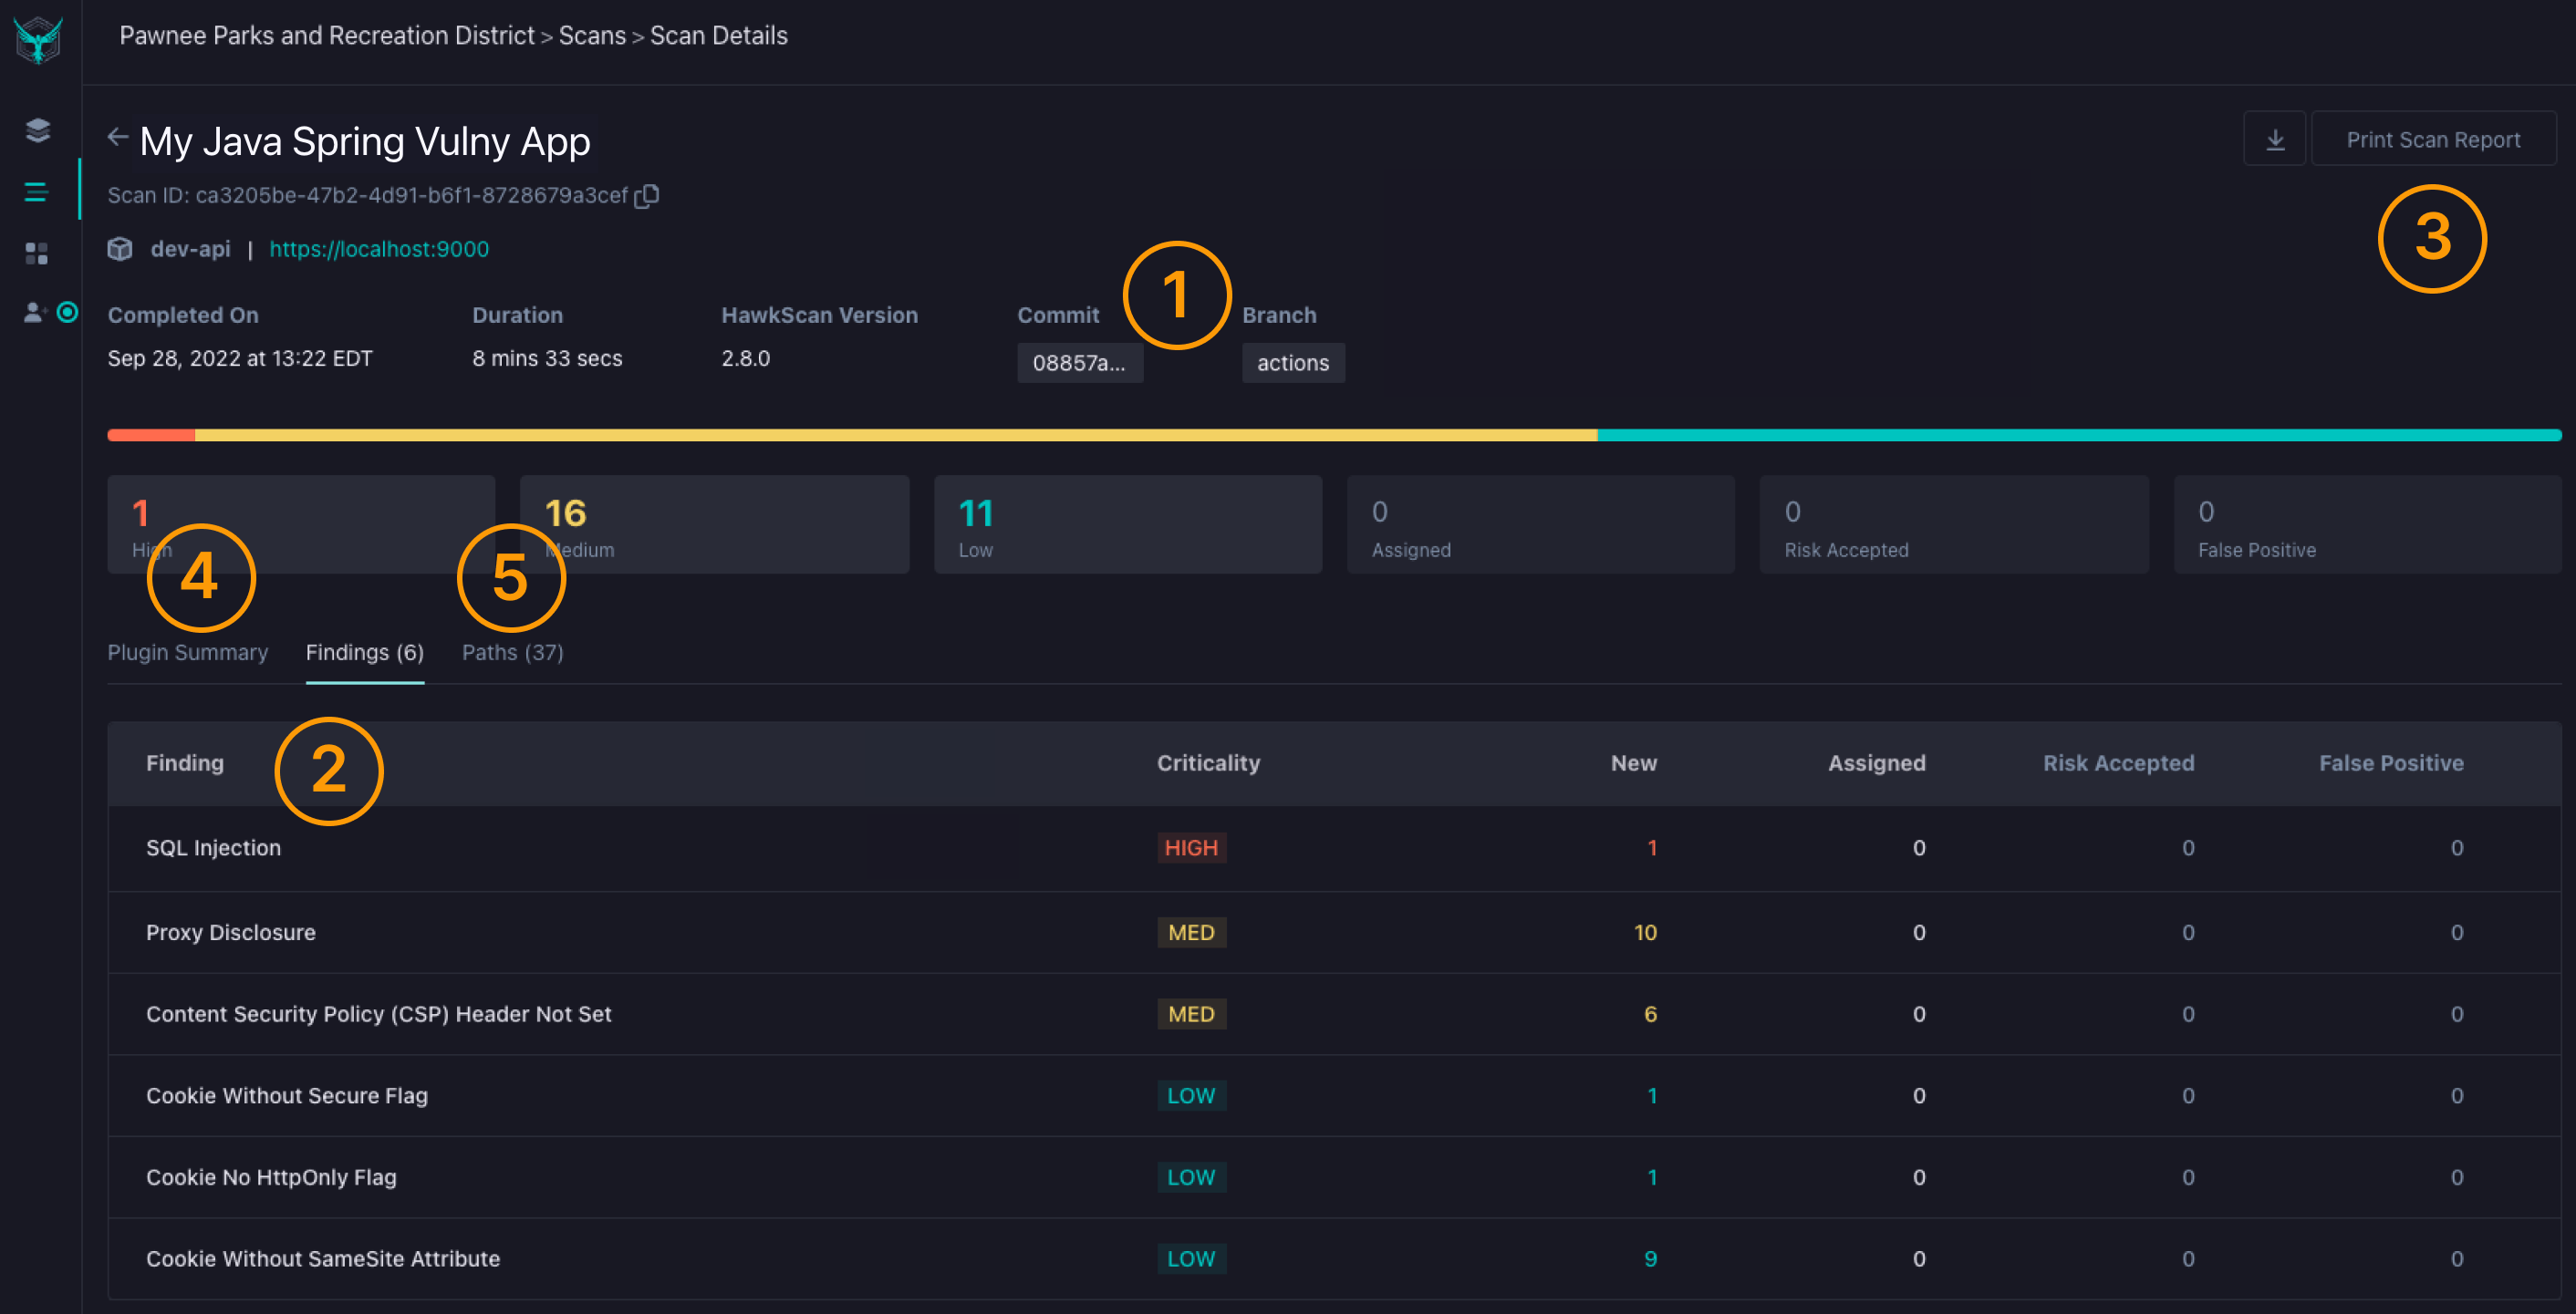
Step 9: View Your Results
Once the scan completes, you can explore findings in the StackHawk platform. Each finding includes remediation guidance, evidence, and the ability to triage issues.
- Click View on StackHawk platform in the workflow log
- Explore findings by severity
- Click any finding for remediation guidance
Resources
Authenticated Scanning
Learn how to scan protected endpoints that require login credentials or session tokens.
GitHub Code Scanning
Surface security findings directly in GitHub's Security tab alongside other code analysis tools.
HawkScan Configuration
Customize scan behavior with authentication, path exclusions, and OpenAPI spec integration.