Datadog
StackHawk’s official Datadog integration.
Overview
The Datadog integration sends scan data to your Datadog account for monitoring and analysis.
Features
- Sends scan log data to your connected Datadog account.
- Log data is provided in JSON format and can be processed into metrics for Datadog dashboards.
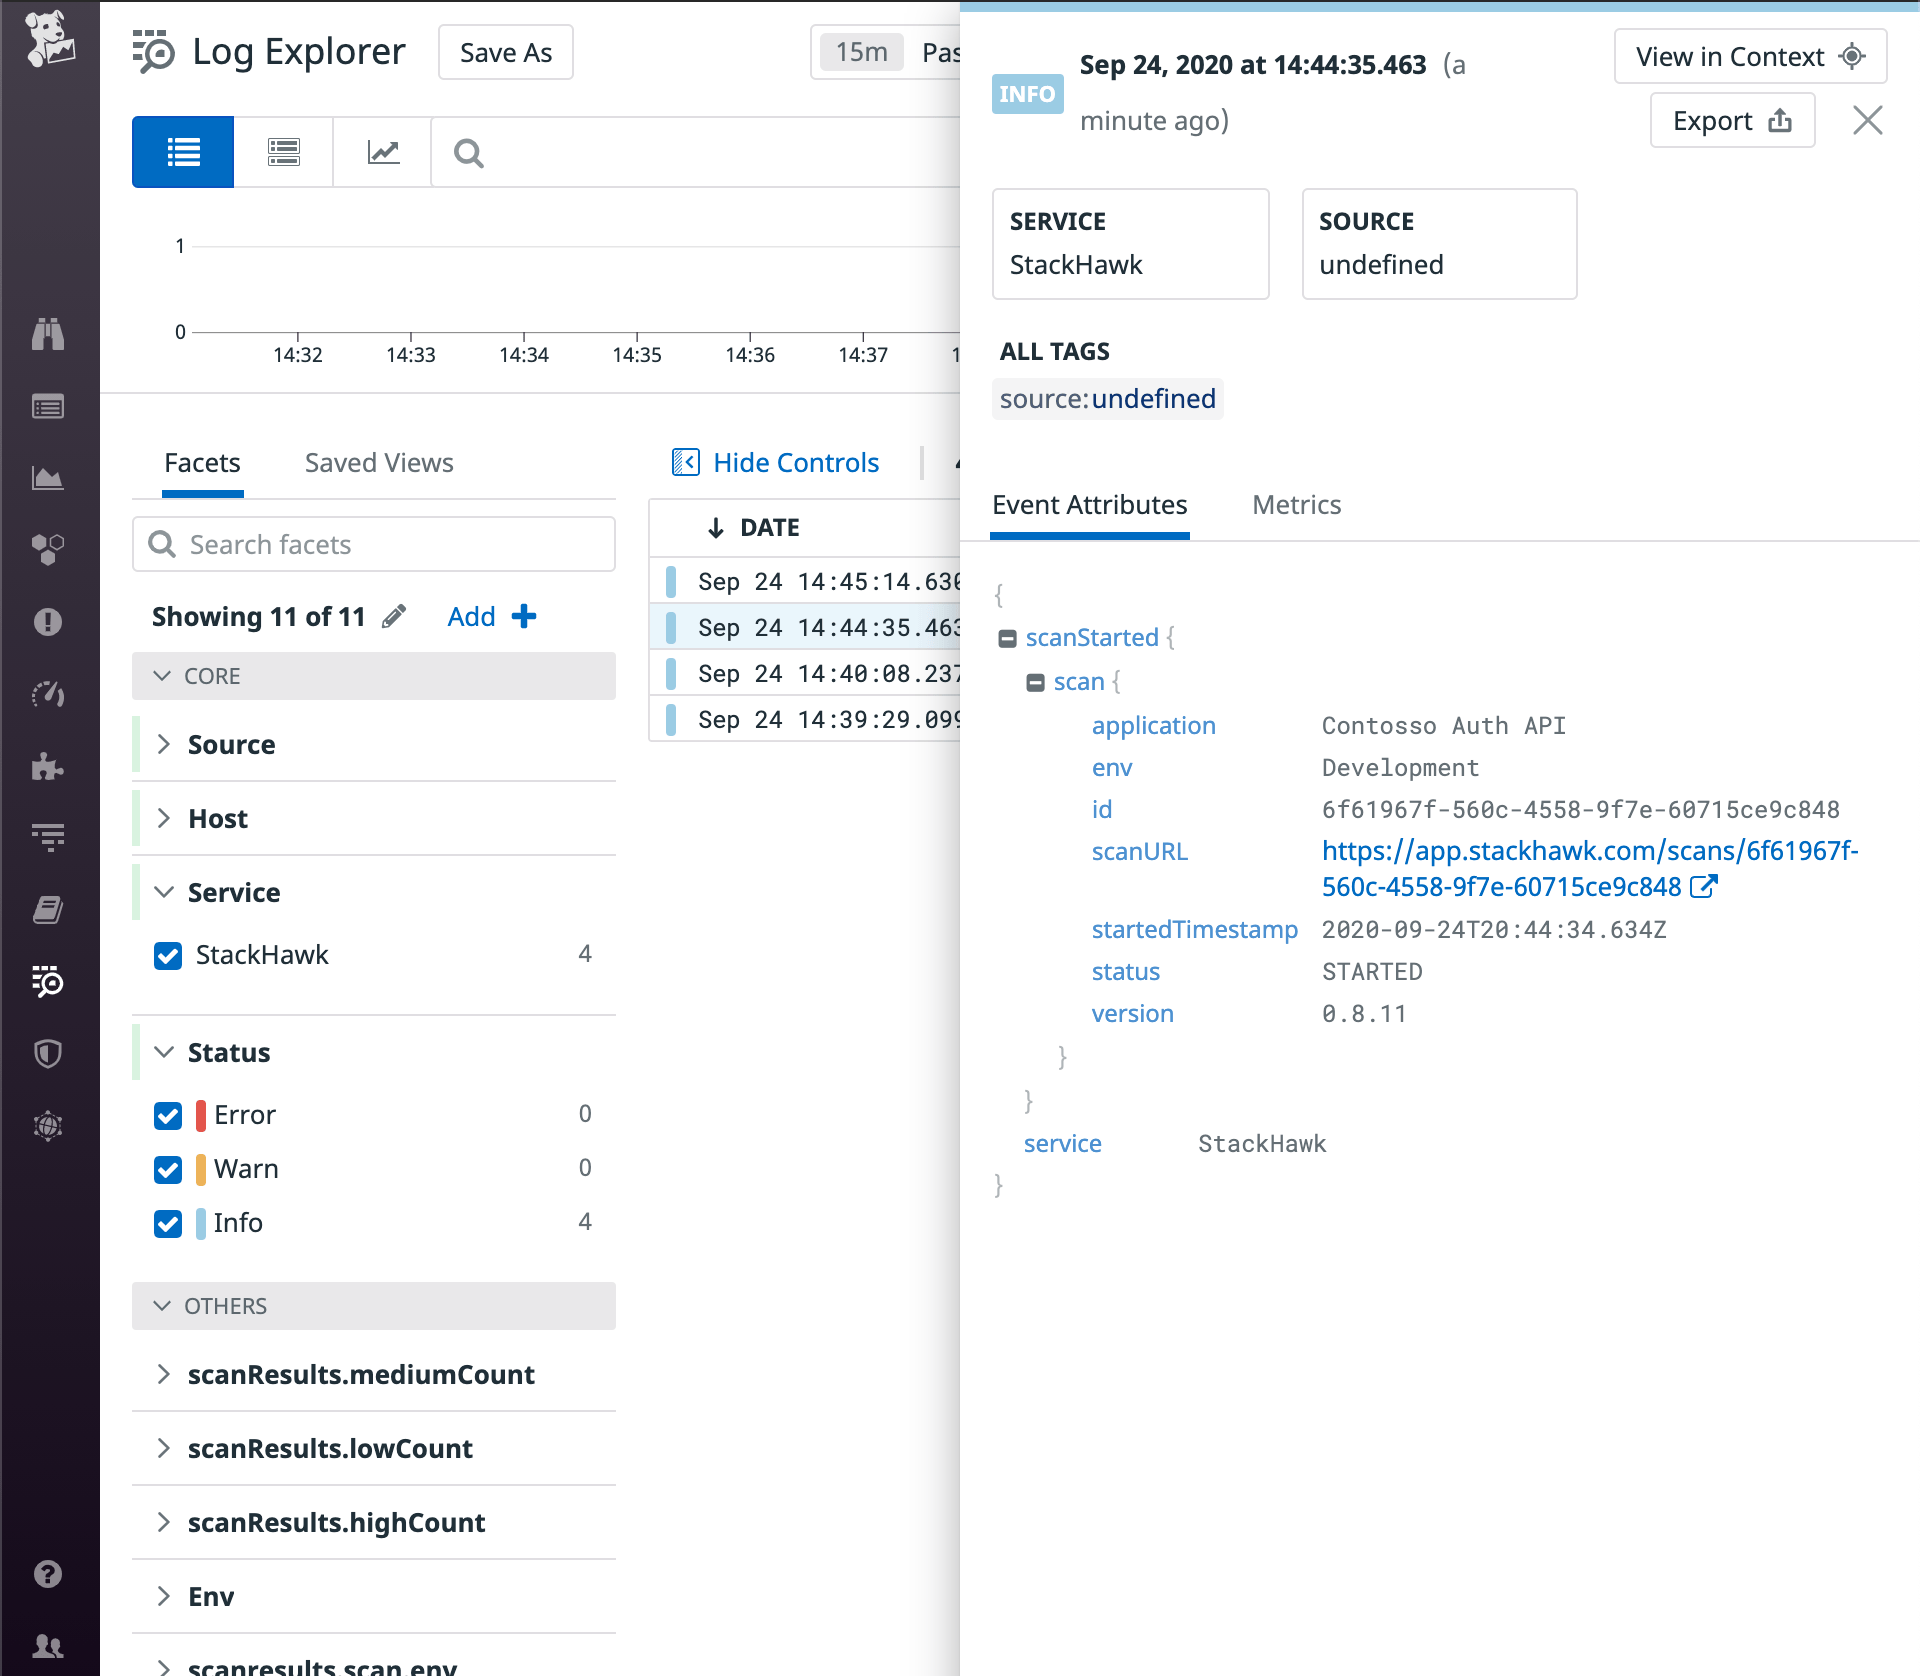
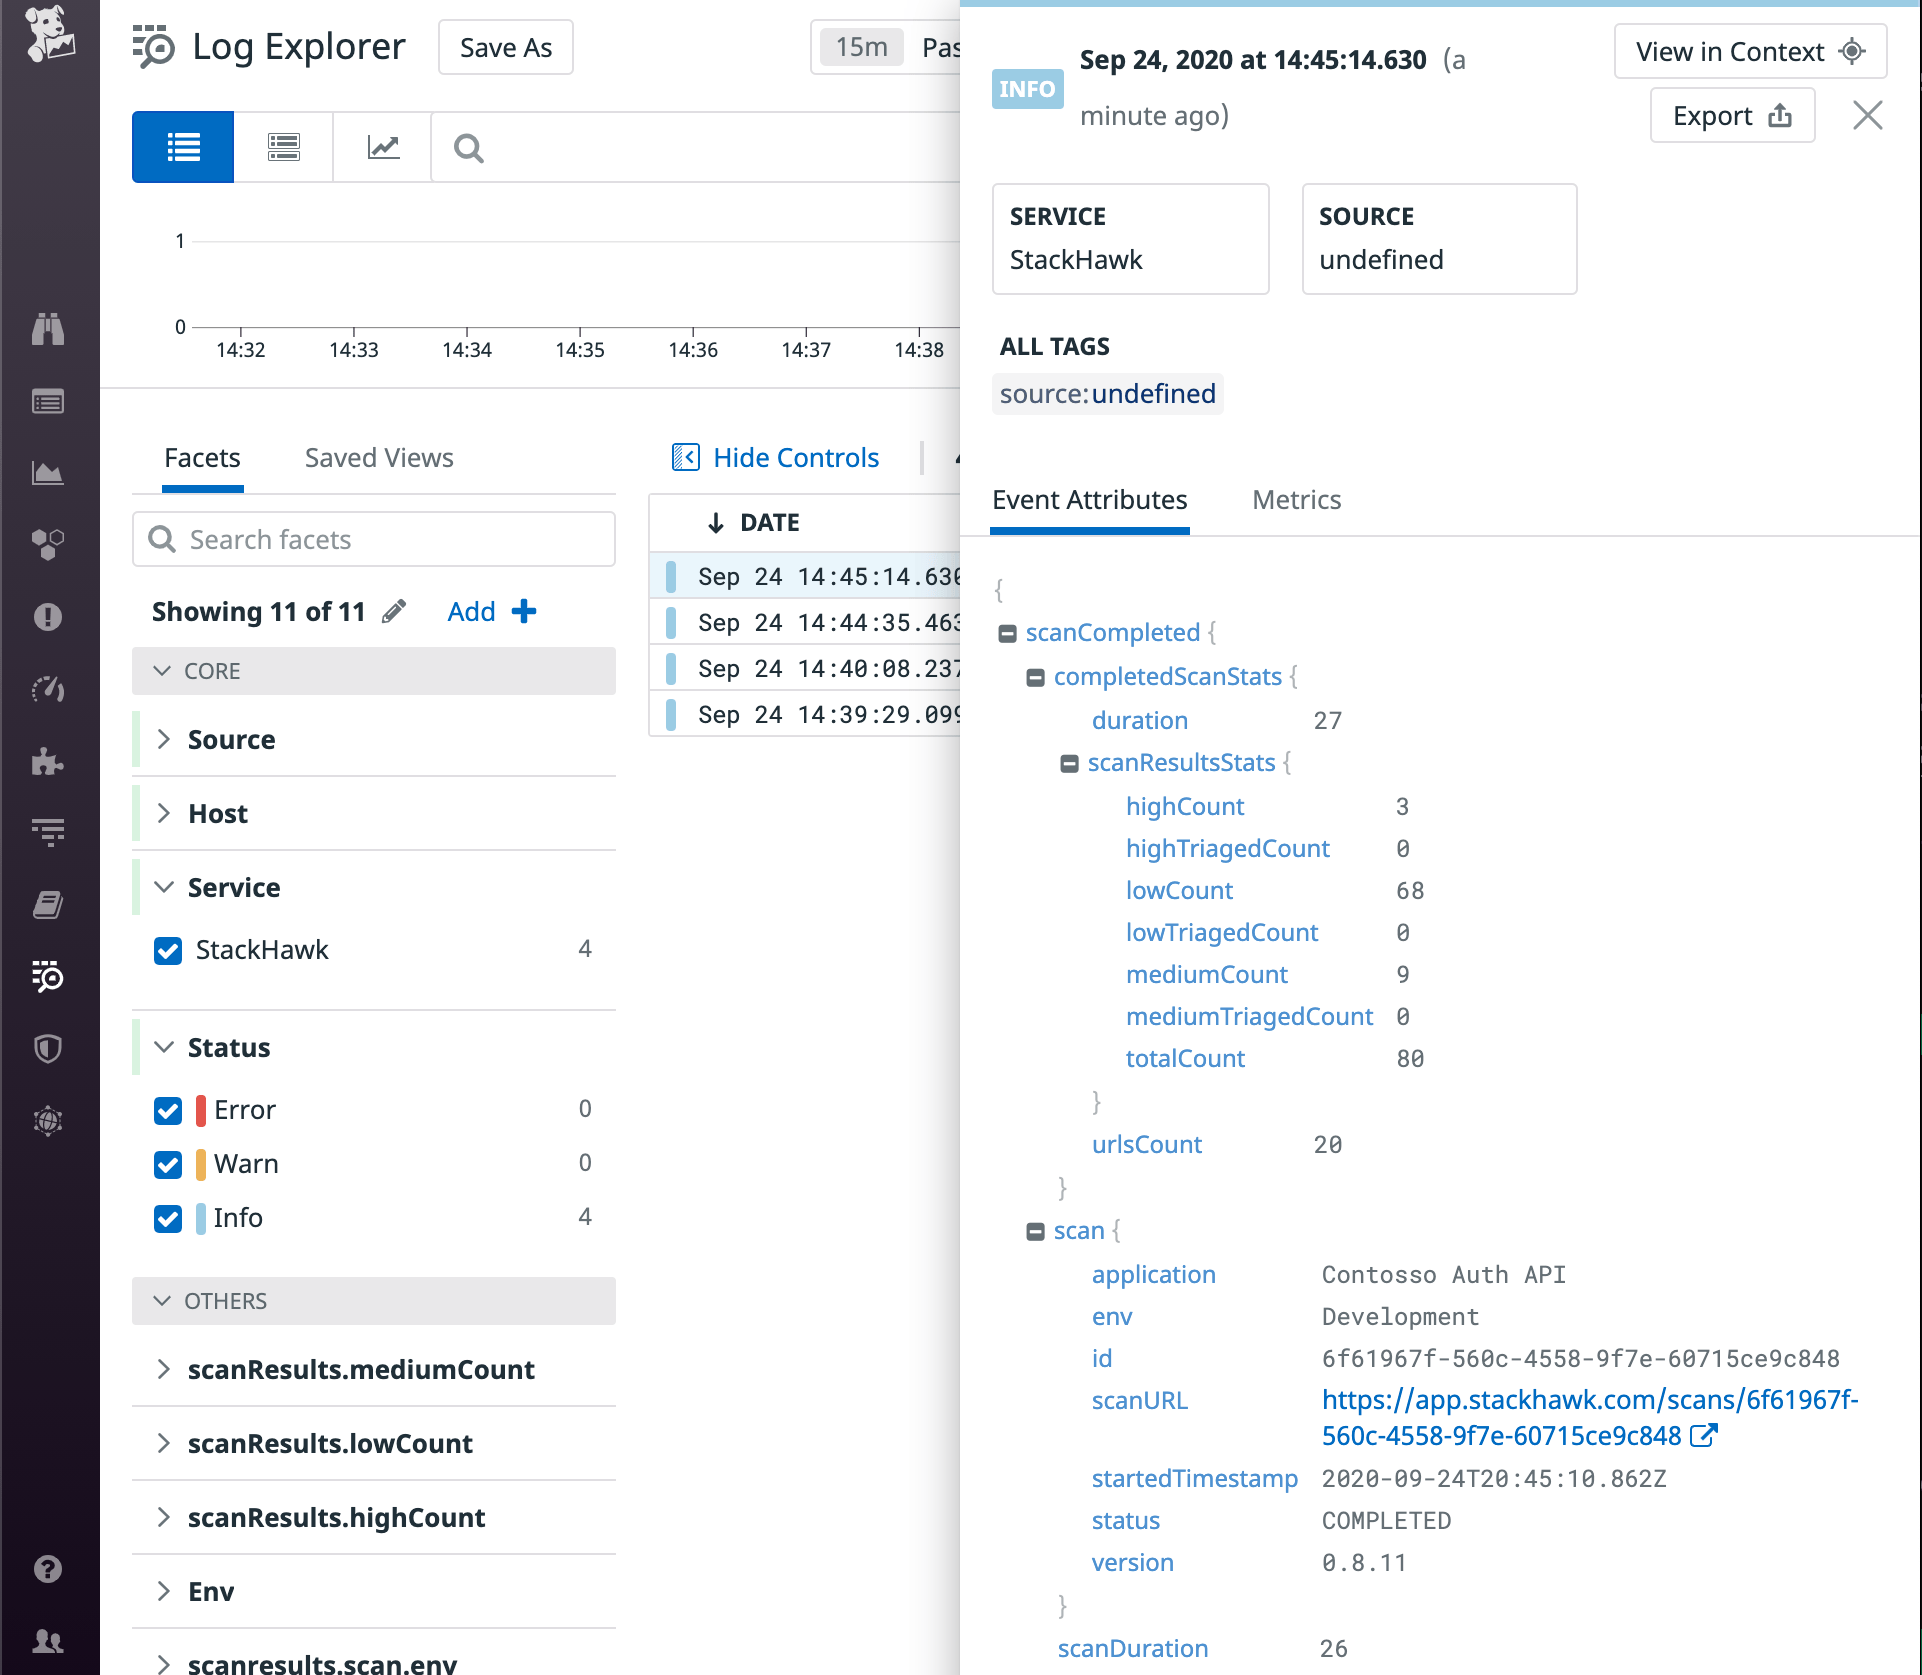
- View scan result aggregates when HawkScan starts and completes. On scan failures, log data includes error conditions and stacktrace.
Requirements
StackHawk:
- You must have a StackHawk account.
- Your StackHawk Organization must belong to a plan with The Datadog Integration enabled. Reach out to StackHawk Support to enable it.
Datadog:
- You must be currently signed-in or be able to login to the Datadog team you wish to add the integration to.
- You must have sufficient permissions to create a Datadog API key. This is only available to users with the Datadog Admin Role.
Setup
Click here to authorize the Datadog Integration in the StackHawk Platform
- Log into StackHawk and visit the Datadog Integration page.
- Click Add Datadog. This opens a panel to provide your Datadog API key. You can find and create a new Datadog API key in the settings panel of your Datadog web app.
- Once authorized, the Datadog integration is complete. Run HawkScan to have logs sent to your Datadog web UI.
Usage
Run HawkScan
With the Datadog integration installed, scan logs are sent to your Datadog instance whenever HawkScan runs.


When HawkScan runs, contextual scan data will be sent to the Datadog Log Explorer in JSON format for easy parsing and contextual analysis.
Feedback
Have any suggestions, feature requests, or feedback to share? Contact StackHawk Support.
